
It's Time for a Unified Chromaticity Diagram
The pandemic has certainly distracted me from regular posting here. I’m probably not back to posting weekly, or even monthly, but I do have a new topic and a few things to say about it. The topic is color science as it applies to lighting.
No doubt you’ve seen something like Figure 1 before. It’s the CIE 1931 (x, y) chromaticity diagram and is the most common graphic for showing the range of tunable white luminaires and LED colors and their color mixing possibilities.
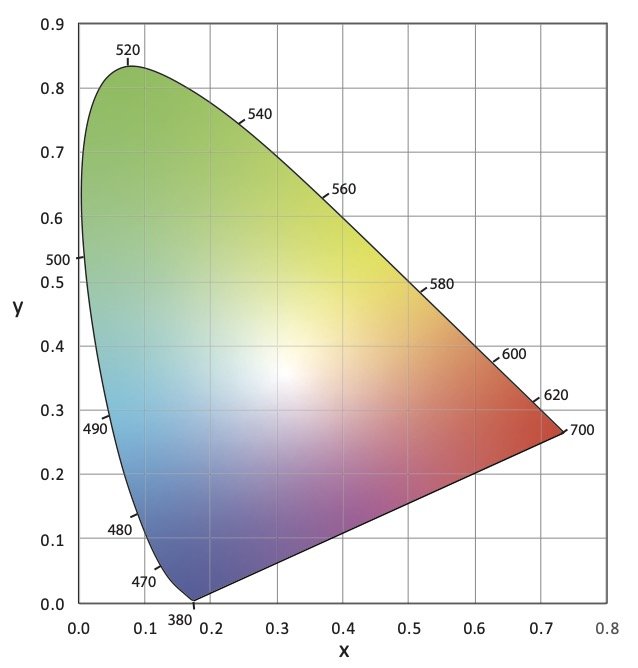
Figure 1 CIE 1931 (x, y) Chromaticity Diagram
The thing is, we keep using this diagram even though it has problems and has been replaced twice. The problem is that it isn’t perceptually uniform, which means that the distance between any two color points doesn’t correspond to the perceptual difference between those two colors. This was famously demonstrated in 1942 by David MacAdam as shown in Figure 2. Using 25 chromaticities he had a trained observer, using a device that allowed for the color adjustment of light, attempt to create a side-by side match from different starting points – for example match a yellow sample starting from green, then match it again starting from red, etc. When he plotted the results in CIE 1931 (x, y) the area where color differences could not be detected formed an ellipse as shown in Figure 3. This demonstrated that the color space was not perceptually uniform. If it was the ellipses would have been circles.

Figure 2 CIE 1931 (x, y) Chromaticity Diagram with MacAdam Ellipses at 10x Size
These “MacAdam ellipses” have become the default way manufacturers talk about color consistency of their products. You’ll often see statements on cut sheets saying that the LEDs for a particular product line all fall within an X-step MacAdam ellipse (2-step, 3-step, etc.). Want to hear something crazy? In 2014, the International Commission on Illumination (CIE), which sets the standards for most things related to color and light, recommended ending the use of MacAdam ellipses. Why? Look at Figure 2 again. The size of MacAdam ellipses changes as we move around the chromaticity diagram. So does anything related to them, such as Standard Deviation Color Matching (SDCM) another, although less common, measure.
The first attempt to address the uniformity problem resulted in the CIE 1960 (u, v) uniform chromaticity scale (USC) diagram (Figure 3). Correlated color temperature was originally calculated in the CIE 1960 (u, v) UCS.

Figure 3 CIE 1960 (u, v) UCS
It was later discovered that the CIE 1960 (u, v) USC diagram also was not uniform. To improve uniformity the v-axis was scaled by 1.5, resulting in the CIE 1976 (u’, v’) UCS diagram shown in Figure 4. As the most uniform UCS diagram, CIE 1976 (u’, v’) is the one recommended for use when calculating or evaluating color differences, not CIE 1931 (x, y).

Figure 4 CIE 1976 (u’, v’) UCS
The definition of correlated color temperature originally used CIE 1960 (u, v). However, since that diagram is no longer recommended for any purpose by the CIE, we use CIE 1976 (u’, v’) but scale it back to CIE 1960 (u, v). This is described as CIE 1976 (u’, 2/3 v’).
The CIE’s 2014 recommendation mentioned earlier replaced MacAdam ellipses with a circle in the CIE 1976 (u’, v’) UCS. A rough rule of thumb is that one MacAdam ellipse corresponds to a circle with a radius of 0.0011. Unfortunately, it doesn’t seem that any manufacturers have made this transition.
So, our industry is in a situation where we commonly use a 90 year old first generation diagram that was replaced 61 years ago. We calculate CCT in a third generation chromaticity diagram that is 45 years old but tweek the math to refer back to a second generation 61 year old diagram. It’s crazy! No other industry uses a system this convoluted.
Why am I mentioning this? I was recently reminded of a paper that was presented at last August’s IES Annual Conference. Presented by Michael Royer of Pacific Northwest National Laboratory, it proposed using the latest color science to make a fresh start with a single new chromaticity diagram that is very similar to CIE 1976 (u’, v’) where we would calculate CCT, the color temperature bins for LEDs, color differences and the rest. IES members can access the archived presentation after logging in to the IES website.
Full disclosure, I’m on the IES Task Group that developed this new system. The Task Group is made up of people in academia, design, manufacturing and research from three countries. We’ve refined our work since August and expect to publish these refinements soon. I encourage all of you to look for and learn about this proposal, to attend seminars when available, and to weigh in on this topic. Would our industry benefit from moving to a unified chromaticity system? Is this the right one? How do we educate specifiers and manufacturers? How do we phase in a new system? We can all have a voice in bringing the science we rely on into the 21st Century.
References
CIE. (2014). TN 001:2014 Chromaticity Difference Specification for Light Sources. Vienna: International Commission on Illumination.
CIE. (2018). CIE 015:2018 Colorimetry, 4th Edition. Vienna: International Commission on Illumination.
MacAdam, D. (1942). Visual Sensitivities to Color Differences in Daylight. Journal of the Optical Society of America, 32(5), 247-274.
Royer, M. et. al. (2020). Improved System for Evaluating and Specifying the Chromaticity of Light Sources. In: Illuminating Engineering Society Annual Conference 2020.